


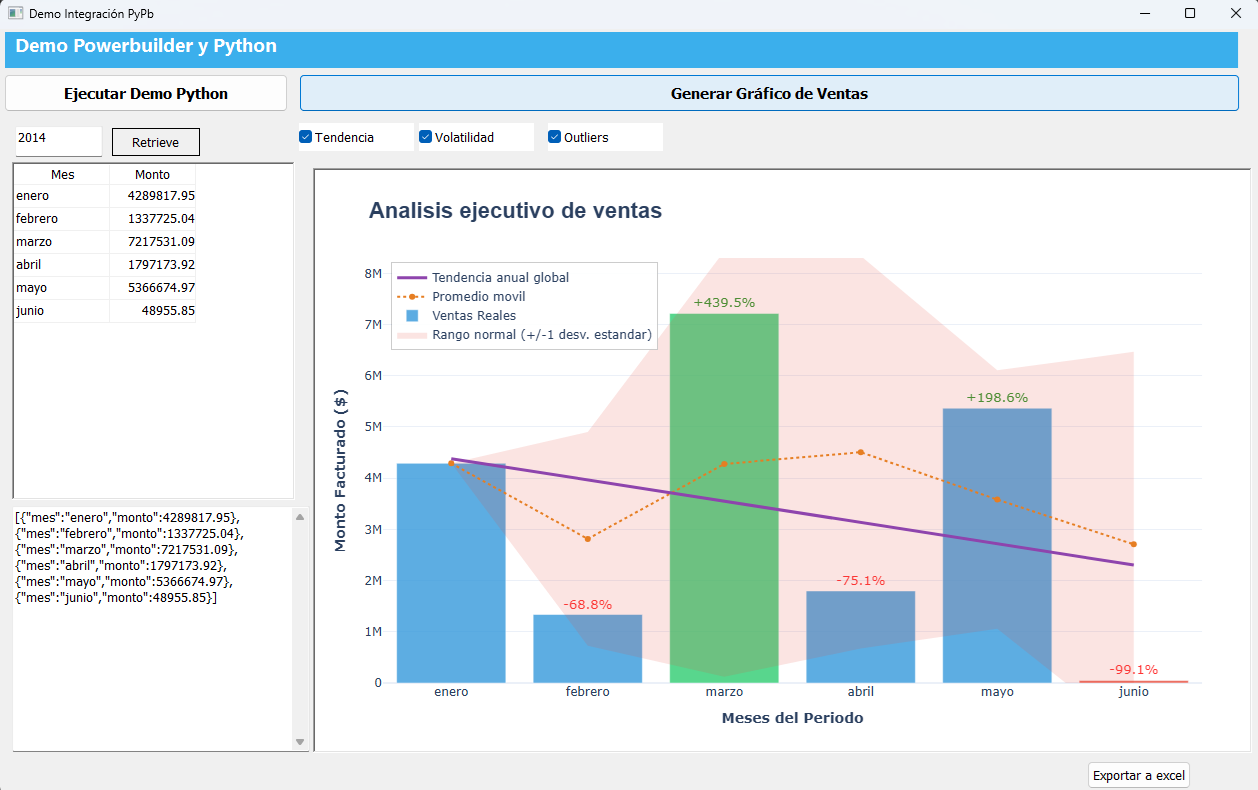
PyPb in Action: PowerBuilder and Python Building Executive Sales Charts
A technical demo of direct integration between PowerBuilder 2025 R2, PyPb, Python, Plotly, and Excel.
Introduction
This demo shows how a PowerBuilder window can execute Python code directly to build interactive visualizations, analyze sales data, and export reports to Excel without turning the application into a web solution or depending on an external API.
The integration is based on PyPb, the project published by Appeon at https://github.com/Appeon/PyPb. According to the official repository documentation, PyPb is a library that wraps Python.NET so PowerBuilder can interact with Python code: import modules, instantiate classes, invoke methods, read properties, and use popular libraries such as pandas, numpy, OpenCV, and openpyxl. In this demo, that concept is used to consume custom Python modules directly from PowerScript.
Visual Result
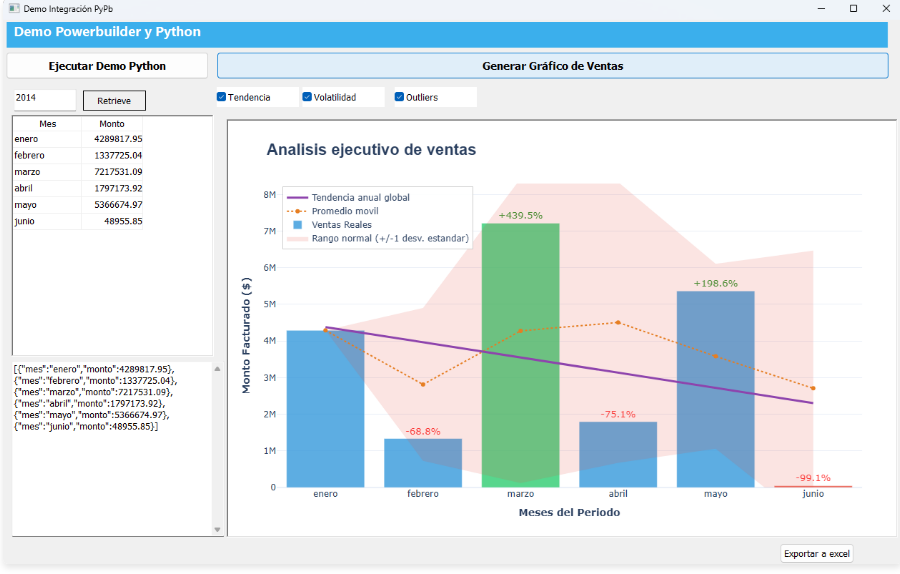
The main window retrieves sales by year from a DataWindow, displays the generated JSON, lets the user select the analytical chart layers, and renders the result inside a WebBrowser control.
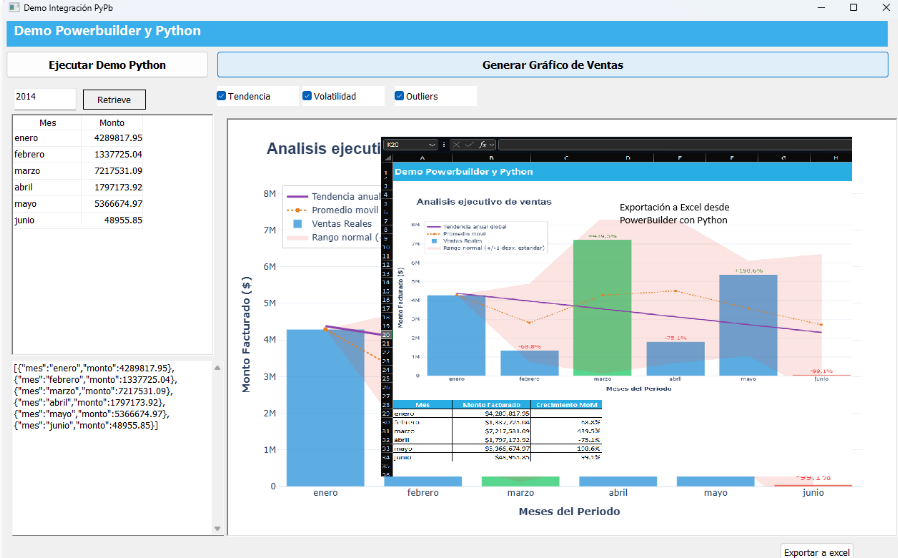
The current chart can also be exported to Excel while preserving the options selected in the window. The resulting workbook includes a blue header, the chart, and a formatted table below it.
General Architecture
The architecture follows a clear separation pattern: PowerBuilder manages the interface, data connection, and user experience; Python calculates and renders the analytical output.
PowerBuilder 2025 R2
|-- w_demo_pypb.srw
|   |-- DataWindow dw_ventas
|   |-- WebBrowser wb_grafico
|   |-- CheckBox Trend / Volatility / Outliers
|   `-- Buttons: Run Python Demo, Generate Chart, Export to Excel
|
|-- PyPb / Python.NET
|   |-- n_cst_pyton
|   |-- n_cst_pypbmodule
|   |-- n_cst_pypbobject
|   `-- n_cst_invocationrequest
|
`-- Portable Python runtime
    |-- graficador_ventas_actual.py
    |-- pypb_demo.py
    |-- plotly
    |-- xlsxwriter
    `-- kaleido
How PyPb Fits Into The Demo
The official PyPb documentation describes a layered architecture: a PowerBuilder application calls PowerBuilder wrapper objects; those objects delegate to .NET components written in C#; those components use Python.NET to initialize the Python runtime and execute real Python modules.
The flow recommended by the repository can be summarized as follows:
- Initialize the Python context by passing the path to
python313.dll. - Import the Python module from PowerBuilder with
of_import. - Create an invocation request with
n_cst_invocationrequest. - Instantiate a Python class with
of_instantiate. - Invoke Python object methods with
of_invoke. - Convert the Python result to a PowerBuilder type, for example with
of_tostring.
In the demo window, that pattern appears directly:
lnv_python = CREATE n_cst_pyton
li_rc = lnv_python.of_init(ls_ruta_python)

lnv_module = CREATE n_cst_pypbmodule
li_rc = lnv_python.of_import("graficador_ventas_actual", lnv_module)

lnv_req = lnv_module.of_createinvocationrequest("GraficadorVentas")
li_rc = lnv_module.of_instantiate(lnv_req, lnv_graficador)

lnv_req = lnv_graficador.of_createinvocationrequest("generar")
lnv_req.of_addargument(ls_json_solicitud)
li_rc = lnv_graficador.of_invoke(lnv_req, lnv_result)
Technical Requirements
| Component | Use in the demo |
|---|---|
| PowerBuilder 2025 R2 | Builds the window, the DataWindow, the selection controls, and the WebBrowser. |
| PyPb | Allows Python code to be invoked from PowerScript by using wrappers compatible with PowerBuilder. |
| Python runtime 3.13 | Distributed inside the python.runtime folder. The demo does not require Python to be globally installed on Windows. |
| Plotly | Generates the interactive HTML chart and the image inserted into Excel. |
| Kaleido | Exports the Plotly figure to an image for the Excel report. |
| XlsxWriter | Creates the ventas_exportadas.xlsx file with formatting, header, chart, and table. |
The PowerBuilder Window: w_demo_pypb.srw
The w_demo_pypb.srw window concentrates the user experience. Its main elements are:
- DataWindow
dw_ventas: retrieves sales by year from the database. - MultilineEdit
mle_1: displays the JSON exported from the DataWindow. - WebBrowser
wb_grafico: renders the HTML file generated by Plotly. - CheckBox
cbx_tendencia: enables or disables the trend line. - CheckBox
cbx_volatilidad: enables or disables the moving average and shaded range. - CheckBox
cbx_outliers: enables or disables the highlight of anomalous values. - Generate Chart button: sends the data and options to Python.
- Export to Excel button: generates the Excel report with the current chart.
To make the demo portable, the of_obtener_ruta_base() function searches for python.runtime\python313.dll next to the executable or in the parent folder. This avoids depending on a global Python installation.
public function string of_obtener_ruta_base ();
string ls_ruta_actual
string ls_ruta_base
string ls_ruta_padre

ls_ruta_actual = GetCurrentDirectory()
if Right(ls_ruta_actual, 1) <> "\" then
    ls_ruta_actual += "\"
end if

ls_ruta_base = ls_ruta_actual
if FileExists(ls_ruta_base + "python.runtime\python313.dll") then
    return ls_ruta_base
end if

ls_ruta_padre = ls_ruta_actual + "..\"
if FileExists(ls_ruta_padre + "python.runtime\python313.dll") then
    return ls_ruta_padre
end if

return ""
end function
JSON Contract Between PowerBuilder And Python
PowerBuilder sends a single JSON argument to Python. This design avoids issues with multiple arguments in dynamic invocations and keeps the contract simple.
{
  "datos": [
    { "mes": "enero", "monto": 4289817.95 },
    { "mes": "febrero", "monto": 1337725.04 }
  ],
  "opciones": {
    "mostrar_tendencia": "S",
    "mostrar_volatilidad": "S",
    "mostrar_outliers": "N"
  }
}
The options are sent as "S" or "N" to avoid serialization ambiguity between PowerBuilder booleans and Python booleans.
Chart Analytical Options
Trend
The Trend option calculates a simple linear regression over the monthly sequence. In Python, it is implemented manually with summations to obtain the slope (m) and intercept (b), producing the following series:
tendencia_lineal = [m * i + b for i in range(n)]
Visually, it is represented as a purple line over the sales bars. Its purpose is to show the general direction of the behavior, even when monthly peaks exist.
Volatility
The Volatility option calculates a short moving average and a moving standard deviation using a two-point window. With those values, two bands are built:
banda_superior.append(promedio_movil[i] + std_movil[i])
banda_inferior.append(promedio_movil[i] - std_movil[i])
In the chart, this appears as a semi-transparent shaded area and a dotted orange moving-average line. It helps identify abrupt variations, regime changes, or months with unstable behavior.
Outliers
The Outliers option calculates a Z-Score against the overall mean and standard deviation of the series. If the Z-Score is greater than 1.0, the bar is marked in green; if it is less than -1.0, it is marked in red. Normal values remain blue.
z_score = (monto - media_total) / std_total if std_total > 0 else 0
if mostrar_outliers and z_score > 1.0:
    colores_barras.append("#2ecc71")
elif mostrar_outliers and z_score < -1.0:
    colores_barras.append("#e74c3c")
else:
    colores_barras.append("#3498db")
The goal is not to replace an advanced statistical model, but to provide an immediate executive reading inside the PowerBuilder application.
Python Files In The Demo
| File | Technical role |
|---|---|
graficador_ventas_actual.py |
Active file used by the window. It defines GraficadorVentas and contains the generar() and exportar_excel() methods. It processes the JSON received from PowerBuilder, normalizes the data, calculates trend, volatility, and outliers, generates the Plotly chart, and produces the final Excel workbook. |
pypb_demo.py |
Minimal educational file. The DemoPyPb class exposes get_system_info() to return the Python version and procesar_texto() to transform a string. It is used to verify that PyPb can instantiate a Python class and call methods from PowerBuilder. |
graficador_ventas_actual.py: Main Engine
The active file is organized around one class:
class GraficadorVentas:
    def generar(self, datos_json: str, opciones_json: str = "") -> str:
        ...

    def exportar_excel(self, datos_json: str) -> str:
        ...
Data Normalization
The method accepts data in several formats: a regular JSON array, JSON text, or rows serialized as text. This tolerance is important because the PowerBuilder/Python bridge can represent data differently depending on the type and serialization path.
if isinstance(datos, str):
    datos = json.loads(datos)

if isinstance(datos, dict):
    datos = list(datos.values())

datos_normalizados = []
for fila in datos:
    if isinstance(fila, str):
        fila = json.loads(fila)
    datos_normalizados.append(fila)
HTML Generation
generar() creates a temporary pb_grafico_ventas.html file and returns its path. PowerBuilder loads it with wb_grafico.Navigate("file:///" + ruta). This strategy allows the full Plotly visual engine to be used inside the WebBrowser control.
Excel Export
exportar_excel() uses the same JSON contract as the chart shown on screen, so the Excel workbook reflects exactly the layers selected by the user. The method:
- Normalizes data and options.
- Calculates the same analytical series.
- Generates a chart image with Plotly + Kaleido.
- Creates
ventas_exportadas.xlsxwith XlsxWriter. - Inserts a blue header, the chart image, and a table below it.
pypb_demo.py: Minimal Integration Test
This file is small, but it is very useful for validating the full PowerBuilder -> PyPb -> Python chain. The DemoPyPb class exposes two methods:
get_system_info(): returns the Python version currently running.procesar_texto(texto): converts the text to uppercase and reverses it.
This verifies that PowerBuilder can import a module, instantiate a class, call a method without parameters, call a method with parameters, and convert the result to text.
Python Module Cache Considerations
During development, an important behavior was observed: an embedded Python session can retain already imported modules. If the .py file changes while the application remains alive, PowerBuilder may continue using the previous module version.
Recommendation: in a final product, keep the definitive module name centralized and restart the application process whenever Python code is updated. During development, changing the module name can be a quick way to avoid cache issues.
Portable Deployment
The official PyPb repository indicates that the target machine needs a compatible Python runtime, or that a compact runtime can be provided with the application. This demo uses the second strategy: distribute the python.runtime folder together with the executable or in the parent folder.
demo_pbpython/
|-- demo_pbpython.exe
|-- demo_pbpython.pbl
|-- pypblib.pbl / pypblib.pbd
|-- bin.pypb.appeon/
|-- python.runtime/
|   |-- python313.dll
|   |-- python.exe
|   `-- Lib/site-packages/
|-- graficador_ventas_actual.py
`-- pypb_demo.py
The bitness must match: if the PowerBuilder application runs in 32-bit mode, the Python runtime and dependencies must be 32-bit; if it runs in 64-bit mode, they must be 64-bit. This matches the PyPb guidance for selecting a runtime compatible with the application architecture.
The python.runtime folder is included so the demo can run on a computer even if Python is not installed globally. Keep this folder in the same directory as the PowerBuilder files, because the window resolves the local runtime from the demo folder.
To run the demo, open the PowerBuilder workspace or target file and execute the application:
demo_pbpython.pbwor
demo_pbpython.pbtOnce the window opens, retrieve the sales data, select one or more chart options, and generate the chart. The available options are:
- Trend
- Volatility
- Outliers
You can also export the current chart and the formatted sales table to Excel. The Excel output uses the same analytical options selected in the PowerBuilder window.
Technical Patterns Applied
| Pattern | Application in the demo |
|---|---|
| Single JSON contract | PowerBuilder sends data and options as one argument to simplify dynamic invocation. |
| Portable runtime | The of_obtener_ruta_base() function locates python.runtime\python313.dll. |
| Python class as a service | GraficadorVentas encapsulates HTML generation and Excel export. |
| WebBrowser as analytical viewer | PowerBuilder displays Plotly HTML without writing JavaScript in PowerScript. |
| Decoupled options | Trend, volatility, and outliers are enabled through simple JSON flags. |
| Excel faithful to the current chart | The export uses the same options selected in the window. |
| Defensive normalization | Python accepts lists, JSON text, and serialized JSON rows to avoid type errors. |
Lessons Learned
- PyPb makes it possible to use complex Python libraries without rewriting analytical logic in PowerScript.
- PowerBuilder remains excellent as a layer for interface, data, and business operation.
- The contract between PowerBuilder and Python must be explicit; JSON works very well as a boundary.
- The Python runtime must match the architecture of the PowerBuilder application.
- When working with embedded Python, module caching must be considered during development and deployment.
- Plotly and XlsxWriter can generate high-quality executive outputs from a traditional desktop application.
References
- Appeon/PyPb on GitHub: documentation used as the basis for building the demo.
- PyPbLib introduction: architecture, components, wrappers, and general usage flow.
- Official PyPb demo: sample included by Appeon to demonstrate how to use the library.
- Plotly Python: interactive chart generation and image export.
- XlsxWriter: Excel file creation and formatting from Python.
Conclusion
This demo demonstrates that PowerBuilder can integrate with Python in a modern way without losing its nature as an enterprise desktop application. PyPb acts as a bridge between both worlds: PowerBuilder keeps the interface, the DataWindow, and the user experience; Python contributes analysis, visualization, and report-generation libraries.
The result is a PowerBuilder window capable of producing executive visualizations with trend, volatility, and outliers, as well as exporting a professional Excel workbook that respects the user's selection. It is a practical example of how to extend existing PowerBuilder applications with modern analytical capabilities using PyPb.
Comments (0)