As of PowerBuilder 11.5, DataWindow columns have been able to have background gradients. In that gradients can be data-driven by expressions, this tip will review how columns can emulate bar graphs.
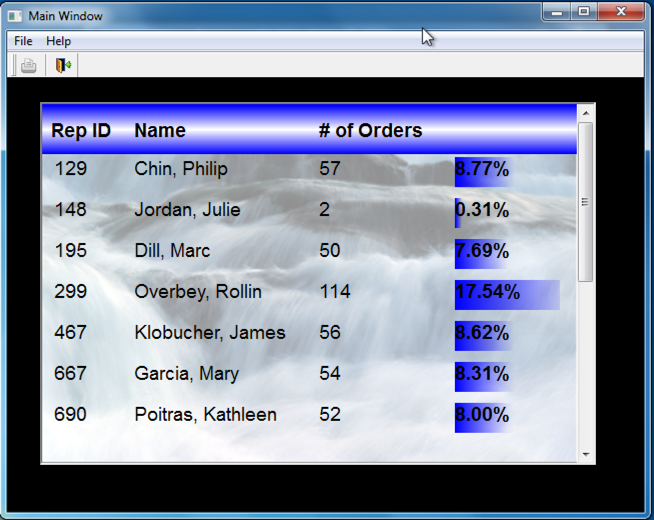
For this example, I’ve created a DataWindow object that displays sales orders by sales rep and I’ve created a computed field that displays each rep’s quantity of orders as a percentage compared to the total count of orders for all sales reps.
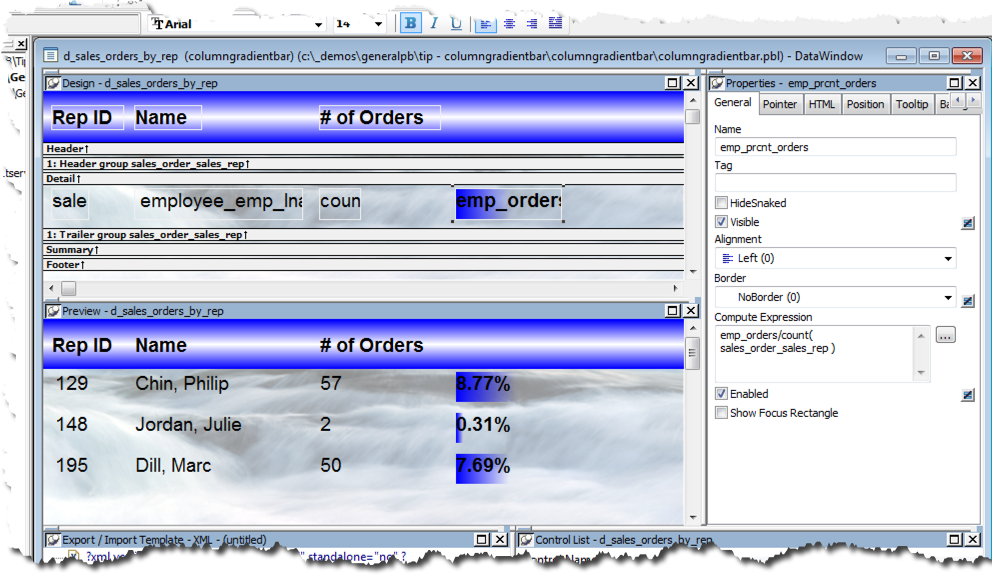
To have the column’s background gradient behave as a bar in a bar graph, first institute the background gradient itself. Here I’ve chosen a horizontal gradient that will be blue in color.
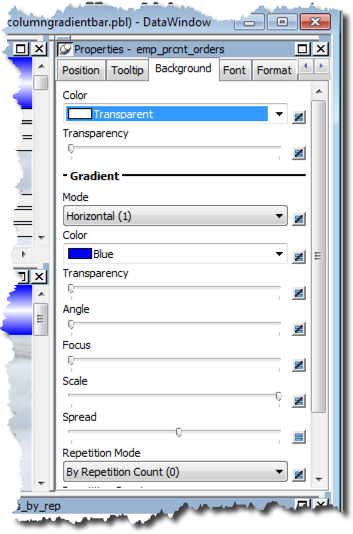
Next, I’ve set the gradient’s Transparency, Angle and Focus to a value of zero, and the Scale to 100%.
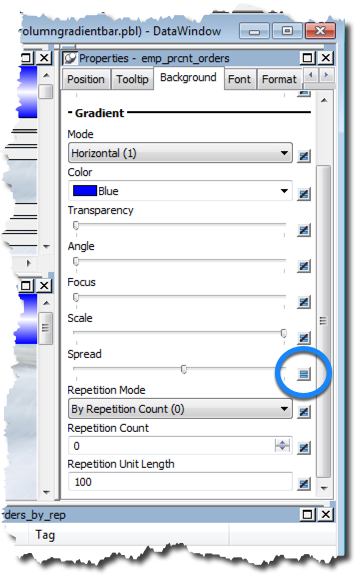
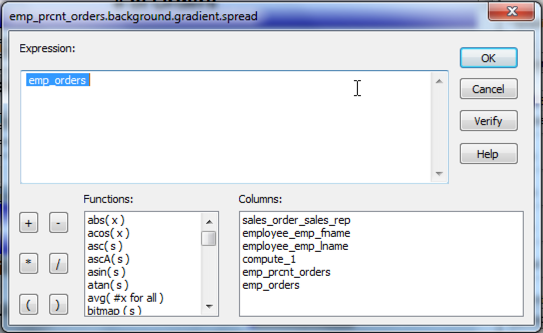
Now I’ll institute an expression for the gradient’s Spread. Here I’ve simply used the quantity of each rep’s orders.
And now you have it. The column’s background gradient now has the column emulate a bar chart giving the user proportionate data visualization…with zero scripting!


Comments (0)