Graphically manipulate data with the Datawindow Graphical Network Editor
***This code will be used in a 2025 Appeon Elevate Conference session. I will be updating the source code as needed until then.***
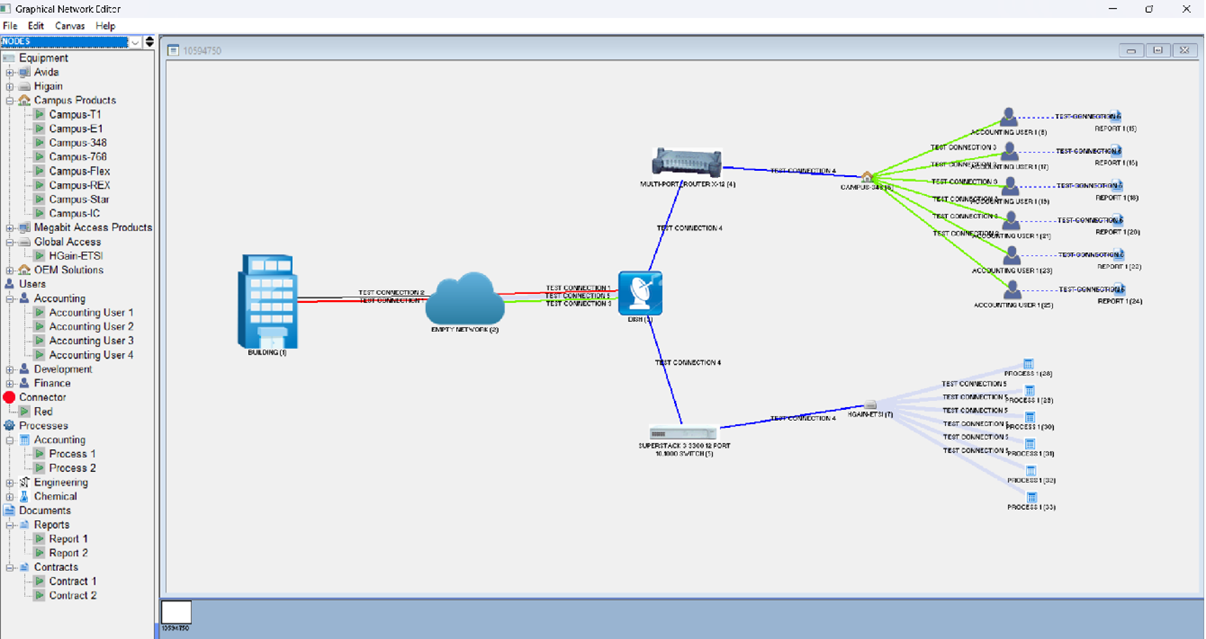
The graphical network editor is a prototype app to find out how well the datawindow works in displaying and manipulating data graphically. It originated while working at a telecommunication software company to see if there was a better way to view and maintain network data visually rather than with lists and maintenance screens. It was developed mostly in Powerbuilder v.6 to v.8 so it is essentially a standalone client server app. It currently running in Powerbuilder 2019 and will run in any later version. Feel free to try it out and take any of the code or techniques that may help you in your own development efforts. Make sure you create the database with the included db_script.sql file and modify the connection for you own database environment. Also include all images in the directory with the source code. There is a help file and how to document. Put all help images into a /help/ subdirectory.
***This code will be used in a 2025 Appeon Elevate Conference session. I will be updating the source code as needed until then.***
Current version as of 11/10/2025
This message has an attachment file.
Please log in or register to see it.
Last Edit: 8 months 1 week ago by Buck Woolley . Reason: Updated source code.
Please Log in or Create an account to join the conversation.
This is very cool. Thanks.
Please Log in or Create an account to join the conversation.