Tech Articles


Data-Driven Column Gradient Bar


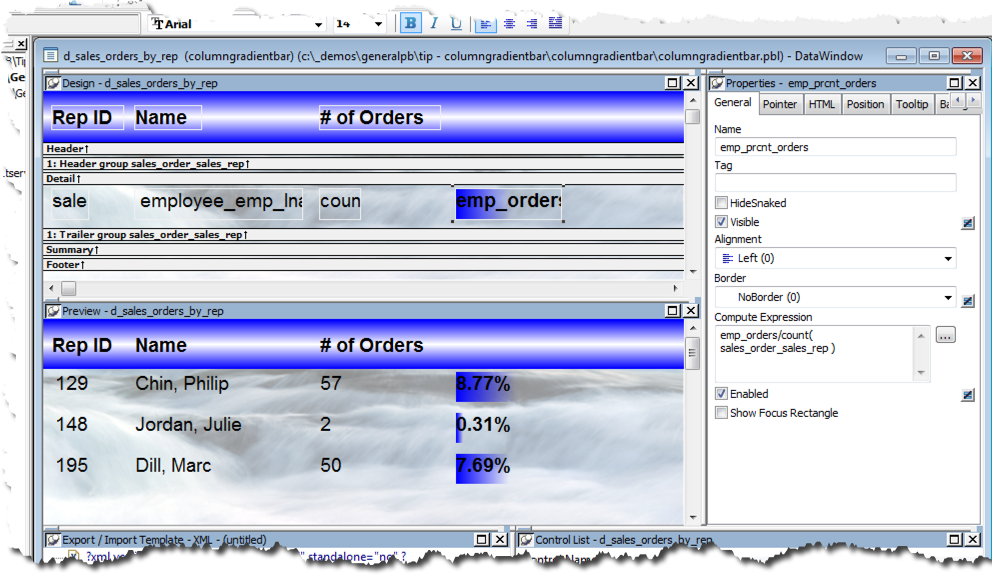
As of PowerBuilder 11.5, DataWindow columns have been able to have background gradients. In that gradients can be data-driven by expressions, this tip will review how columns can emulate bar graphs.

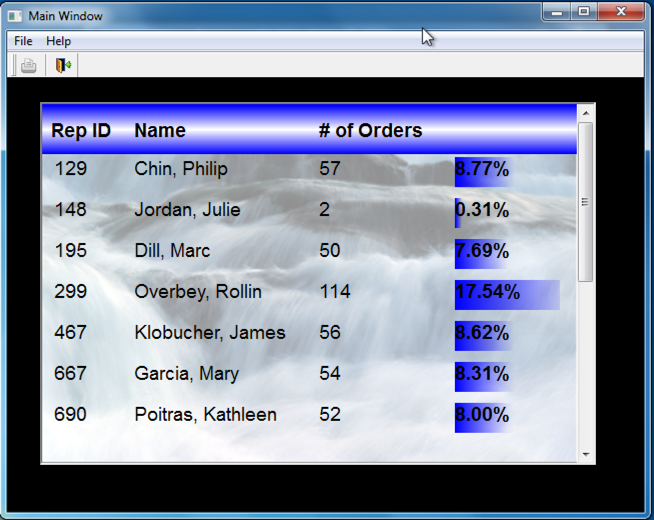
For this example, I’ve created a DataWindow object that displays sales orders by sales rep and I’ve created a computed field that displays each rep’s quantity of orders as a percentage compared to the total count of orders for all sales reps.

DataWindow Painter - Computed Field

To have the column’s background gradient behave as a bar in a bar graph, first institute the background gradient itself. Here I’ve chosen a horizontal gradient that will be blue in color.

Computed Field's Background Properties

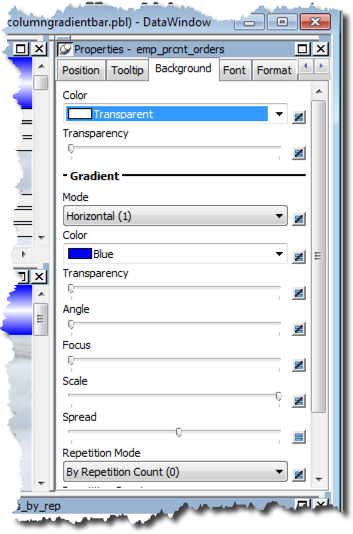
Next, I’ve set the gradient’s Transparency, Angle and Focus to a value of zero, and the Scale to 100%.

Spread property of column background gradient

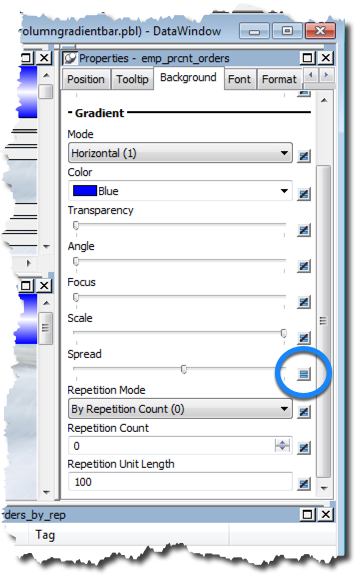
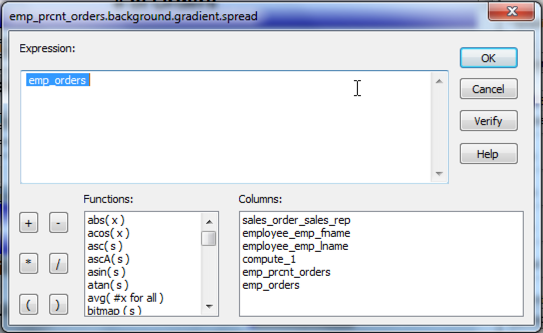
Now I’ll institute an expression for the gradient’s Spread. Here I’ve simply used the quantity of each rep’s orders.

Spread property value of the gradient

And now you have it. The column’s background gradient now has the column emulate a bar chart giving the user proportionate data visualization…with zero scripting!

Data visualization of percentages using a gradient is achieved

Comments (0)
There are no comments posted here yet

Find Articles by Tag

TortoiseGit DataWindow Messagging PFC Event Handling Graph SqlModelMapper DevOps CrypterObject JSONParser Sort PowerBuilder (Appeon) Database Table Schema PowerBuilder Compiler Web Service Proxy Source Control CoderObject Branch & Merge WebBrowser Design Database Connection SDK Export PowerBuilder Event Handler Database Painter API Debugger Encoding .NET Assembly UI Modernization MessageBox BLOB Validation RibbonBar Builder PBVM Model PowerServer Web PBNI Installation PDFlib SQL Server InfoMaker Service Database Table Data Web API PBDOM Git Trial HTTPClient PostgreSQL ODBC driver Application Windows OS .NET DataStore COM Configuration Menu Visual Studio Debug Database JSON Charts GhostScript Filter Repository Array Bug RibbonBar External Functions Elevate Conference Script SnapObjects Resize Interface Export JSON File Debugging SOAP TLS/SSL Oracle PowerScript (PS) JSONGenerator OAuth UI Themes Database Object CI/CD OrcaScript Database Profile DataWindow JSON PostgreSQL SnapDevelop Linux OS Data Error Migration Import JSON 32-bit ODBC Window Text DataType SqlExecutor TreeView Source Code iOS Transaction Database Table License Performance Import Deployment Class Authentication Expression Variable Stored Procedure SVN SQL ActiveX XML OLE PowerServer Mobile Mobile DLL C# Syntax PDF WinAPI TFS Jenkins Automated Testing RESTClient Authorization Icon NativePDF UI DragDrop REST RichTextEdit Control .NET Std Framework Testing OAuth 2.0 Windows 10 Icons Event 64-bit Platform Azure Outlook Excel Android Encryption Open Source IDE